In today’s age of exponentially increasing data volumes, data analysis is crucial for organizations continually striving to make informed decisions.
Analyzing data involves visualization, which simplifies complex data sets and helps uncover patterns, correlations, and insights that may not be visible in traditional tabulated data.
If you’re looking to become a data-driven enterprise, you need a business intelligence platform that provides data visualization functionality, like Microsoft Power BI.
Power BI has become a popular platform to connect, transform, and visualize data from varied sources. Power BI dashboards are effective tools for representing data and provide businesses with an intuitive interface to interact with their information.
If you’re looking to maximize your investment in Power BI, you’re in the right place. In this post, we provide an overview of Power BI dashboards before exploring the top eight Power BI dashboard examples of 2024.
Power BI Dashboards: An Overview
Power BI is a data visualization tool primarily used for business intelligence. It allows you to visualize data, create reports, and share insights across different teams. While commonly used by business analysts, it’s also built to be easily accessible for those without a background in data science or analytics.
Power BI dashboards are a collection of visualizations that keep updating as the associated data changes. They’re designed to present the most important aspects of your data in a concise way for quick insights and rapid decision-making.
These dashboards also have a feature called Q&A, which allows you to ask natural language questions about your data. For example, if you type, “How were last month’s sales?” Power BI attempts to provide a relevant visualization based on the available data.
Power BI can analyze data from different data sources, including:
- Traditional databases, including MySQL, SQL Server, and Oracle
- Cloud platforms like Azure
- Online services such as Google Analytics and Salesforce
After connecting to the data source, you can use Power BI tools such as the Power Query Editor to transform the data so that it meets your requirements. A drag-and-drop interface allows you to build charts, graphs, and tables for easy visualization and analysis. As a result, you’re able to easily transform raw data into meaningful insights for informed decision-making.
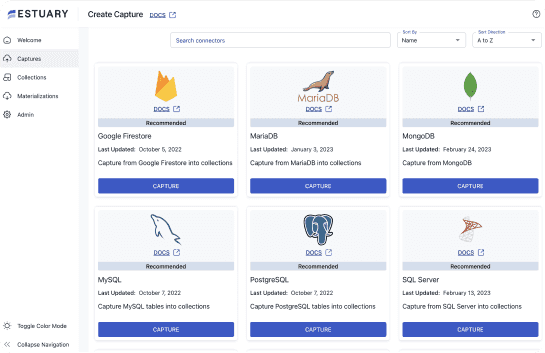
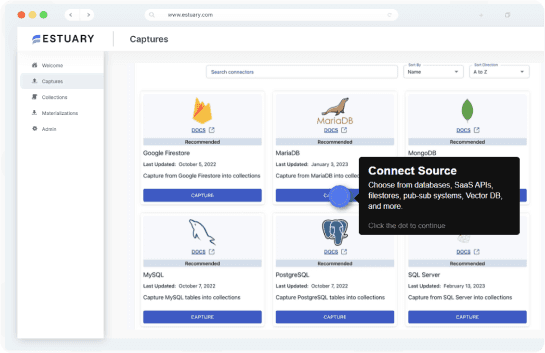
While Power BI is a favorable choice for in-depth data analysis and visualization, you first need to collect all the relevant data for the analysis. To do this, consider using Estuary Flow, which is purpose-built to integrate data from a diverse range of sources — such as databases, cloud storage, and SaaS platforms — into a centralized data warehouse. After you’ve done that, you can connect Power BI with the data warehouse to obtain insights.
Another key feature of Power BI dashboards is that you can share your dashboards with other Power BI users within your organization. This makes collaboration easier, ensuring everyone is informed with the latest insights. Even when the underlying data changes, shared dashboards continue to update for everyone — giving each user access to a trustworthy data set.
Many of today’s leading organizations use Power BI because it delivers a number of benefits:
- User-friendly interface. Power BI has an intuitive interface that you can use to visualize and analyze data easily. Teams can get up to running quickly without a massive learning curve.
- Customizable dashboards. Power BI allows you to create customizable dashboards and reports to display data in whichever way is most meaningful.
- Collaboration. Power BI lets you share your dashboards and reports with others, making it easier to collaborate on data analysis projects.
- Real-time data. Power BI supports real-time data processing; you can view up-to-date data in your dashboards and reports.
Top 8 Power BI Dashboard Examples
Power BI dashboards are frequently used to analyze data across various domains. For example, marketing professionals can use Power BI dashboards to assess the performance of various campaigns, measure conversion rates, and understand customer behavior. Retail managers may use it to track sales data, inventory levels, customer feedback, and purchasing trends.
An interactive dashboard provides a visual representation of key metrics and KPIs, allowing users to delve deeper into specific data and visualize it using various graph styles and visual elements.
In this section, let’s explore eight Power BI dashboard examples to give you a better idea of how you might be able to use this powerful platform within your organization. These examples will highlight key insights such as important sales metrics, customer-wise growth and profit statistics, performance analysis, campaign success, workforce demographics, and key performance indicators in various industry contexts.
1. Sales Dashboard
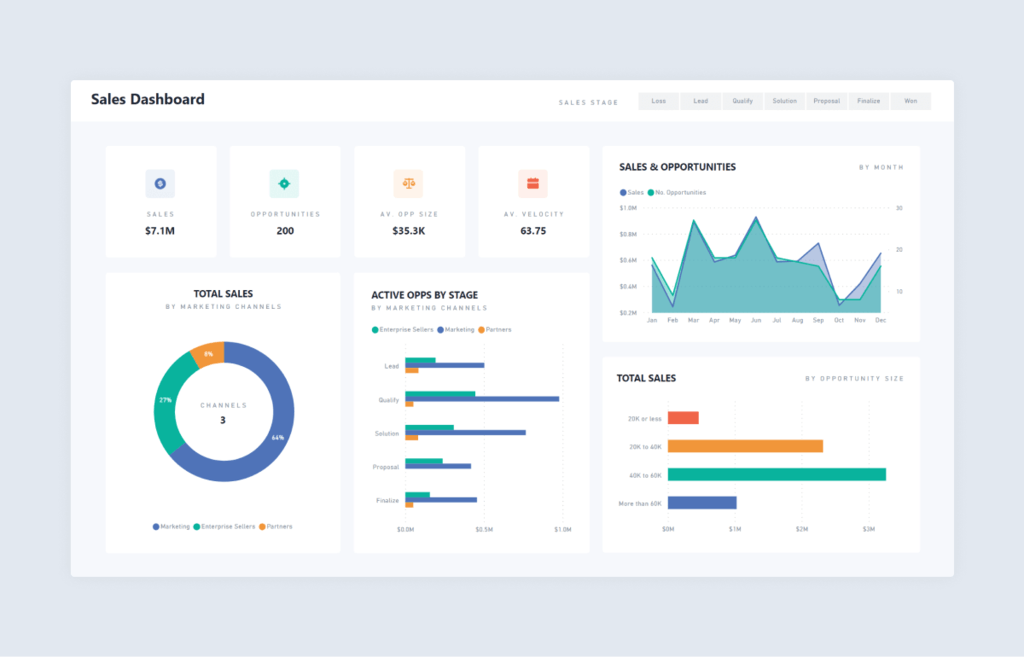
The Sales dashboard is designed to provide a comprehensive view of sales performance, tracking metrics like yearly, quarterly, and monthly sales and sales by region.
Sales managers can use this dashboard to understand team performance, set goals, and make strategic decisions. It helps them identify high-performing products or regions, analyze how the business is performing, and figure out where to focus efforts to meet sales targets. It also provides an overview of the sales to date along with granular details about each opportunity, including relevant sales materials.
Some elements of the Sales dashboard include KPIs (for sales, number of opportunities, and average opportunity size), Donut Charts (for total sales of each marketing channel), and Area Charts (for sales and opportunities by month).
Use Cases:
- Predictive Sales Forecasting: Leveraging AI and machine learning to forecast future sales based on historical trends and external factors.
- Sales Rep Performance Gamification: Using dashboards to create competitive leaderboards and incentivize top performance.
- Real-Time Sales Tracking: Integrating with live data sources to monitor sales as they happen, allowing for immediate adjustments.
Trends in 2024:
- Embedded Analytics: Incorporating sales dashboards directly into CRM systems for seamless access.
- Focus on Customer Lifetime Value: Shifting from transaction-based metrics to long-term customer profitability analysis.
- Mobile-First Design: Optimizing dashboards for mobile devices to empower sales teams on the go.
2. Marketing Campaign Dashboard
Curious about the impact of your marketing efforts? Try the Marketing Campaign dashboard, which is used to assess the performance and ROI of different marketing campaigns to determine their effectiveness.
The dashboard is beneficial for optimizing budgets, refining strategies, and determining which channels and campaigns provide the best results through data-driven decision-making.
If you’re involved in marketing campaigns and strategies, you can use this dashboard to measure campaign performance and allocate resources accordingly. The Marketing Campaign dashboard is typically used by marketing managers, advertising specialists, digital marketing executives, and content strategists.
Some elements of the Marketing Campaign dashboard include KPIs (for ROI, conversion rate), bar charts, line graphs (for campaign performance), pie charts (for budget allocation and spending), and a heatmap (for geographic distribution).
Use Cases:
- Attribution Modeling: Analyzing the impact of various touchpoints across the customer journey for better budget allocation.
- A/B Testing: Quickly comparing the performance of different campaign variations to optimize results.
- Social Media Sentiment Analysis: Integrating with social listening tools to track brand perception and campaign effectiveness.
Trends in 2024:
- Personalization at Scale: Using dashboards to segment audiences and tailor campaign messaging for maximum impact.
- Cross-Channel Campaign Integration: Analyzing the combined effect of campaigns across multiple platforms (email, social, etc.).
- Emphasis on Data Privacy: Complying with stricter regulations while still gaining valuable insights.
3. Customer Segmentation Dashboard
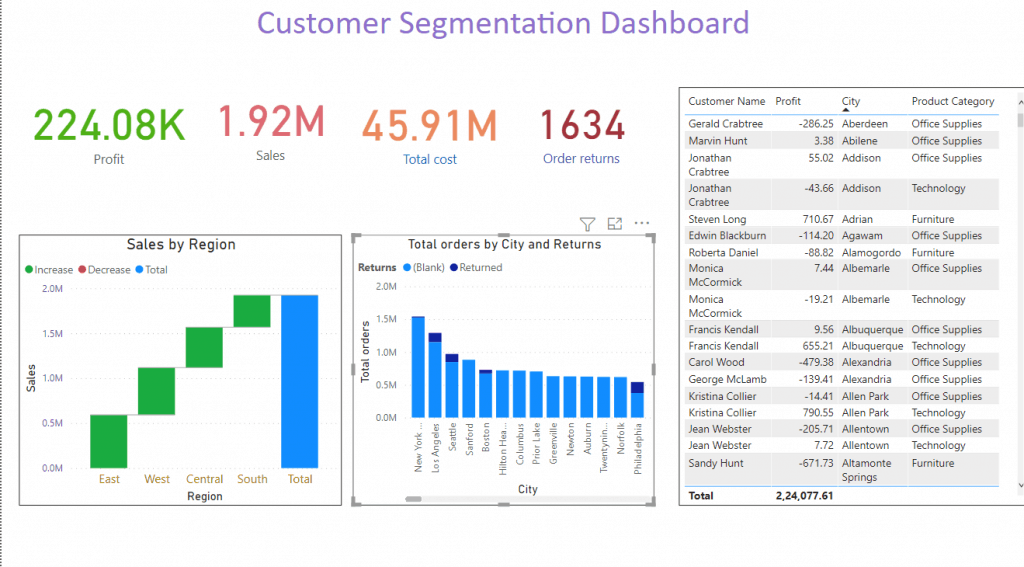
This dashboard segments the customer base based on demographics, purchasing behavior, and other similar criteria. You can use this to tailor your products, services, and marketing strategies, targeting specific segments to enhance customer engagement.
Some key metrics involved in analysis using the customer segmentation dashboard include customer lifetime value, churn rate, purchasing patterns, and customer feedback scores.
The Customer Segmentation dashboard is typically used by marketing analysts, customer relationship managers, and product managers to understand distinct customer groups.
This dashboard includes elements like tree maps (for favored products or services), histograms (for purchase behaviors), donut charts (for product preference), and pie charts (for customer acquisition details).
Use Cases:
- Hyper-Personalization: Creating highly tailored experiences based on individual customer preferences and behaviors.
- Churn Prediction: Identifying customers at risk of leaving and implementing retention strategies.
- Next Best Action: Recommending the optimal next steps for each customer segment to drive engagement and conversions.
Trends in 2024:
- AI-Powered Segmentation: Using machine learning algorithms for more accurate and granular customer grouping.
- Omnichannel Customer Journey Mapping: Visualizing customer interactions across different channels for a holistic view.
- Customer Sentiment Analysis: Incorporating qualitative feedback to enhance understanding of customer needs.
4. Product Sales Dashboard
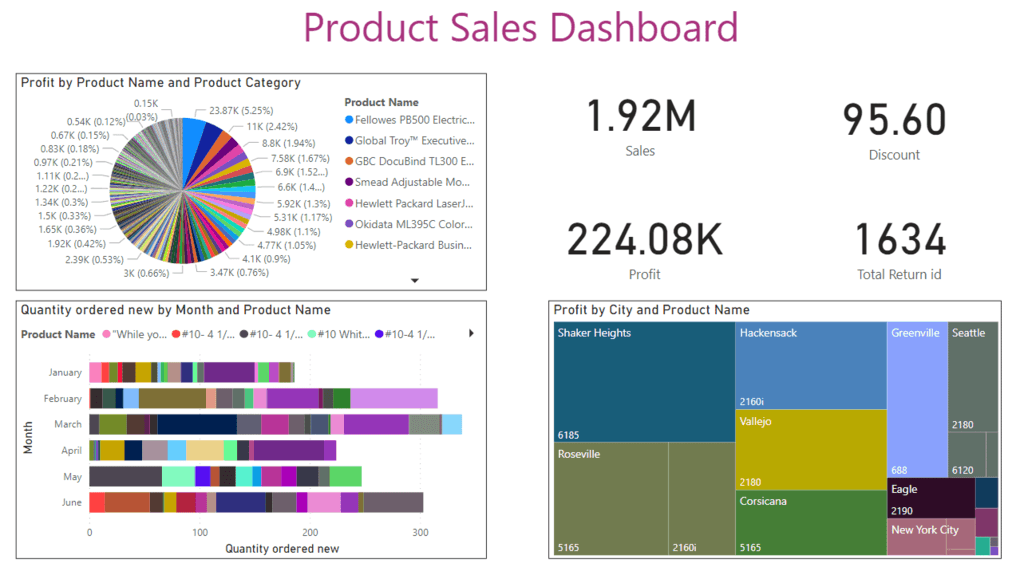
A variation of the Sales dashboard, the Product Sales dashboard focuses on the sales channels and individual products. Such dashboards are particularly beneficial if you have an e-commerce presence and your products are sold across a large number of geographies and websites.
This dashboard is particularly helpful for identifying fast-selling products, managing inventory, and deciding on product pricing or promotions. It shows how each sales channel is doing compared to the previous year.
Sales executives, product or inventory managers, and retail store managers can use this dashboard to understand the sales of different products across different sales channels and areas of improvement.
Some elements of the Product Sales dashboard include bar charts (for sales by product), dual axis charts (for sales vs. returns), column charts (for overall sales performance), and heatmaps (for sales by region).
Use Cases:
- Inventory Optimization: Identifying slow-moving products and adjusting stock levels to reduce carrying costs.
- Price Elasticity Analysis: Understanding how price changes affect demand for different products.
- Competitive Product Benchmarking: Comparing product performance to competitors to identify opportunities for improvement.
Trends in 2024:
- Demand Forecasting: Using advanced analytics to predict future product demand and optimize supply chain management.
- Product Recommendation Engines: Integrating with AI to suggest relevant products to customers based on their purchase history.
- Sustainability Metrics: Tracking and reporting on the environmental impact of products throughout their lifecycle.
5. Social Media Dashboard
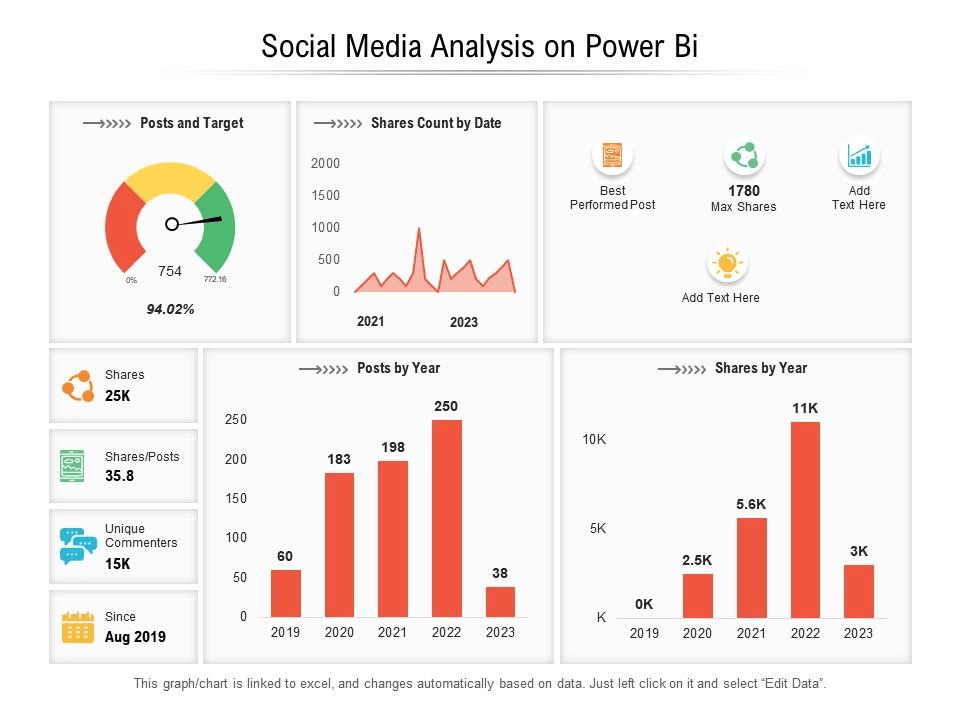
The Social Media dashboard provides an overview of how the social media team’s efforts are impacting the number of impressions and engagement over time. It’s also designed to help identify the best-performing social networks, helping teams better understand where to focus their marketing efforts. You can use the insights obtained from the Social Media dashboard to improve content strategies and build a more robust presence on social channels.
Social media managers and digital marketing professionals use the Social Media dashboard to understand how each of their networks is impacting their audience. At the same time, they also use it to increase a brand’s online presence and create content for social platforms.
Some elements of the dashboard include a bar chart (for impressions by platform), ribbon chart (for impressions by month, split by platform), and donut chart (for impressions % by platform).
Use Cases:
- Real-Time Social Monitoring: Tracking trending topics, brand mentions, and competitor activity to inform rapid response strategies.
- Influencer Marketing Impact Analysis: Measuring the reach and engagement of influencer campaigns to optimize ROI.
- Content Performance Optimization: Identifying top-performing content formats and topics to drive higher engagement.
Trends in 2024:
- Short-Form Video Analytics: Analyzing performance metrics for TikTok, Reels, and other short-form video content.
- Community Building: Focusing on fostering meaningful conversations and interactions with followers.
6. Human Resources (HR) Dashboard
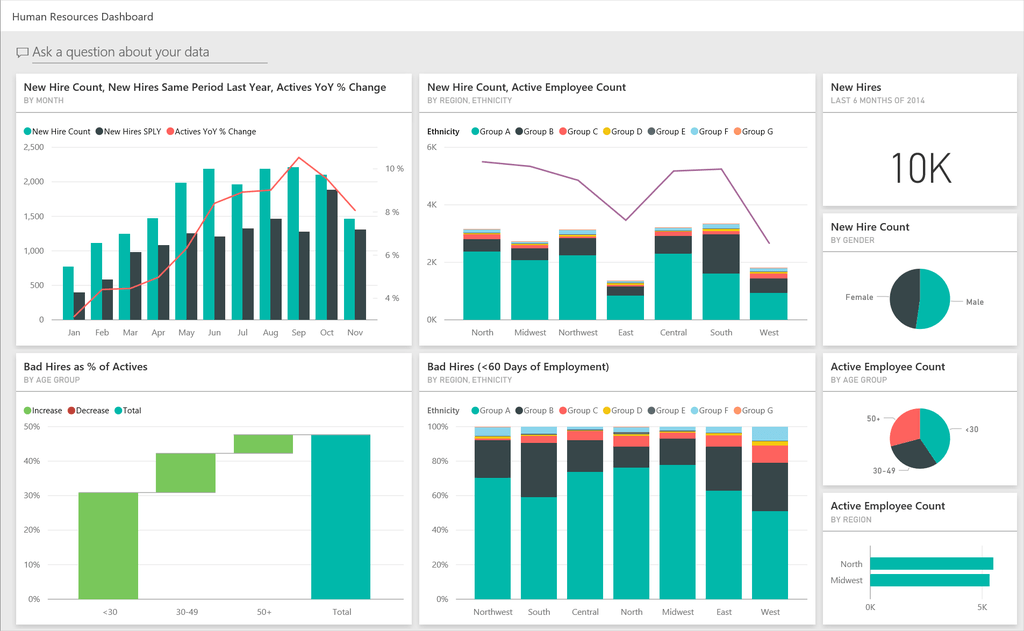
Intended for HR managers, the HR dashboard helps understand employee demographics, track employee performance, and ensure they’re meeting industry standards.
The primary purpose of this dashboard is to gain high-level insights, including average duration and average salary. Using this data, the HR team can manage and optimize the workforce more effectively. Very simply, the dashboard allows HR to better accommodate employees in future company decisions and promote employee well-being.
Among the different elements of the dashboard are an area chart (for new employees per year), bar chart (for the number of employees by region), and key performance indicators (for the number of employees, average salary, average age, and average duration at the company).
Use Cases:
- Diversity and Inclusion Metrics: Tracking progress towards diversity goals and identifying areas for improvement.
- Employee Engagement Surveys: Analyzing feedback to understand drivers of satisfaction and address concerns.
- Skills Gap Analysis: Identifying skills shortages within the workforce and planning targeted training programs.
Trends in 2024:
- Talent Acquisition Optimization: Using data to improve recruitment processes and attract top candidates.
- Remote Work Analytics: Monitoring employee productivity and well-being in remote or hybrid work environments.
- Predictive Analytics for Retention: Identifying employees at risk of leaving and implementing proactive retention strategies.
7. Email Engagement Analytics Dashboard
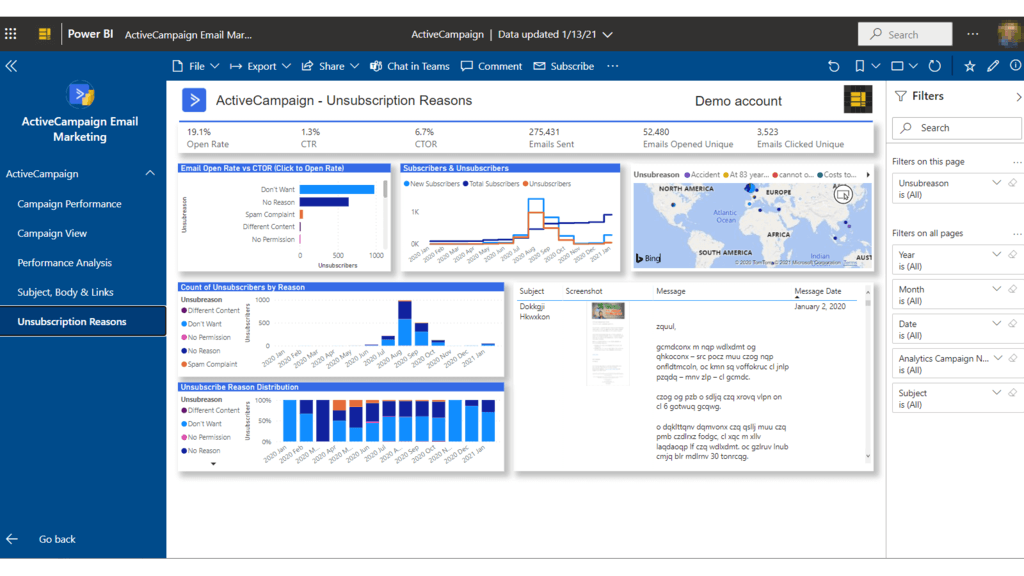
The Email Engagement Analytics dashboard measures the effectiveness of email marketing campaigns. This dashboard is useful for optimizing email campaign content, improving the ROI of email campaigns, and segmenting email lists. It’s particularly helpful if you market your products or services using bulk emails.
The dashboard provides a statistical view of emails that were delivered, clicked, and opened in addition to bounce rates and conversion rates.
Email marketing specialists and CRM managers use this dashboard for insights on subscriber engagement. As a result, they can take a data-driven approach to refining their email content and strategies.
On the Email Engagement Analytics dashboard, you can use bar charts (for open rates or click-through rates), pie charts (for bounce rates), and line charts (for overall email performance).
Use Cases:
- Send Time Optimization: Determining the best times to send emails for maximum open rates and click-throughs.
- Subject Line A/B Testing: Experimenting with different subject lines to improve email open rates.
- Hyper-Personalized Email Campaigns: Tailoring content and offers based on individual recipient behavior and preferences.
Trends in 2024:
- Interactive Email Elements: Incorporating polls, quizzes, or product recommendations to increase engagement.
- Privacy-First Email Marketing: Prioritizing data protection and respecting recipient preferences.
- AI-Driven Email Content Generation: Using natural language processing to create compelling email copy.
8. Finance Dashboard
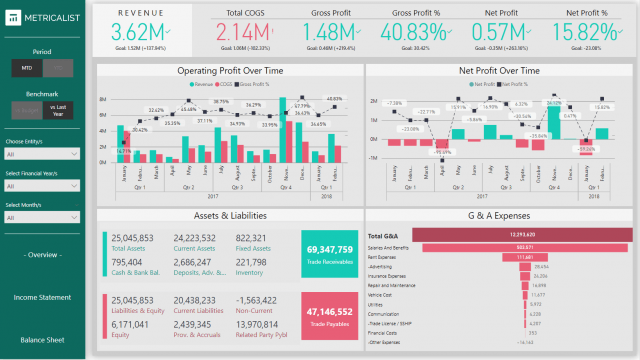
Power BI Finance dashboards can help you gain insights into the financial performance of your organization. You can use this dashboard to track monthly, quarterly, or annual revenue, monitor cash inflows and outflows, and assess the performance of different investments, among other things.
Finance dashboards are typically used by finance managers, analysts, audit teams, and accountants for detailed financial analysis.
The different elements of the dashboard include dual axis charts (for highlighting areas of over or underperformance), pie charts (for segregating expenses into categories), and waterfall charts (for a summarized view of expenses, costs, and revenues).
Use Cases:
- Cash Flow Forecasting: Predicting future cash inflows and outflows to optimize financial planning.
- Risk Management: Identifying and mitigating potential financial risks based on data analysis.
- Budget Variance Analysis: Comparing actual spending to budgeted amounts to identify areas of overspending or underspending.
Trends in 2024:
- Real-Time Financial Reporting: Providing stakeholders with immediate access to the latest financial data.
- ESG Reporting: Tracking and reporting on environmental, social, and governance metrics alongside financial performance.
- Blockchain Integration: Leveraging blockchain technology for secure and transparent financial transactions and record-keeping.
Key Takeaway: Unlock Insights and Fuel Growth with Power BI
The rapidly evolving digital landscape involves massive amounts of data that can give you valuable insights, so long as you have the right tools in place. Leveraging these insights, you can bake informed decision-making and optimized operations into the foundation of your organization.
As you can see, these eight Power BI dashboard examples of 2024 can benefit organizations across all sectors of the economy — from sales and marketing to email campaign management and HR.
These dashboards can help you understand product performance, tailor marketing campaigns, and analyze customer engagement, among other benefits. If you’re looking to become a data-driven organization, consider using Power BI dashboards to utilize the true power of your data and set your business on the course for improved performance and growth.
Frequently Asked Questions (FAQs): Power BI Dashboards
1. How do I create a Power BI dashboard example?
You can create a dashboard from scratch, from a report, from a dataset, or by duplicating an existing dashboard. Follow these steps to create a Power BI dashboard include:
- Download and install the Power BI desktop app
- Import the data source to Power BI
- Format the data in Power BI
- Create visualizations for your Power BI dashboards
2. What are Power BI dashboard examples?
Some Power BI dashboard examples include HR dashboards, Finance dashboards, Sales dashboards, and Marketing dashboards. The purpose of these dashboards is to consolidate data and present it in an easy-to-view and easy-to-analyze format.
3. What is a real-world example of Power BI?
A comprehensive Retail Analytics dashboard is a popular real-world example of a Power BI dashboard. Such a dashboard uses data from multiple sources, including online sales, point-of-sale systems, and customer feedback, to analyze sales data. The visualizations the dashboard produces include sales trends, customer demographics, top-selling products, and seasonal sales variations, helping optimize marketing strategies and stock levels — and ultimately engage and delight your customers.
Related Guides:

About the author
With over 15 years in data engineering, a seasoned expert in driving growth for early-stage data companies, focusing on strategies that attract customers and users. Extensive writing provides insights to help companies scale efficiently and effectively in an evolving data landscape.
Popular Articles

